Motorcycles are one of the safest ways to travel when you count how often each type of vehicle crashes, according to a new study from Los Angeles-based Aghnami Law Group. Measured by average annual crashes per 100,000 registered vehicles, only trains and planes have lower crash rates than bikes.
Photograph by Fernanda via Pexels.
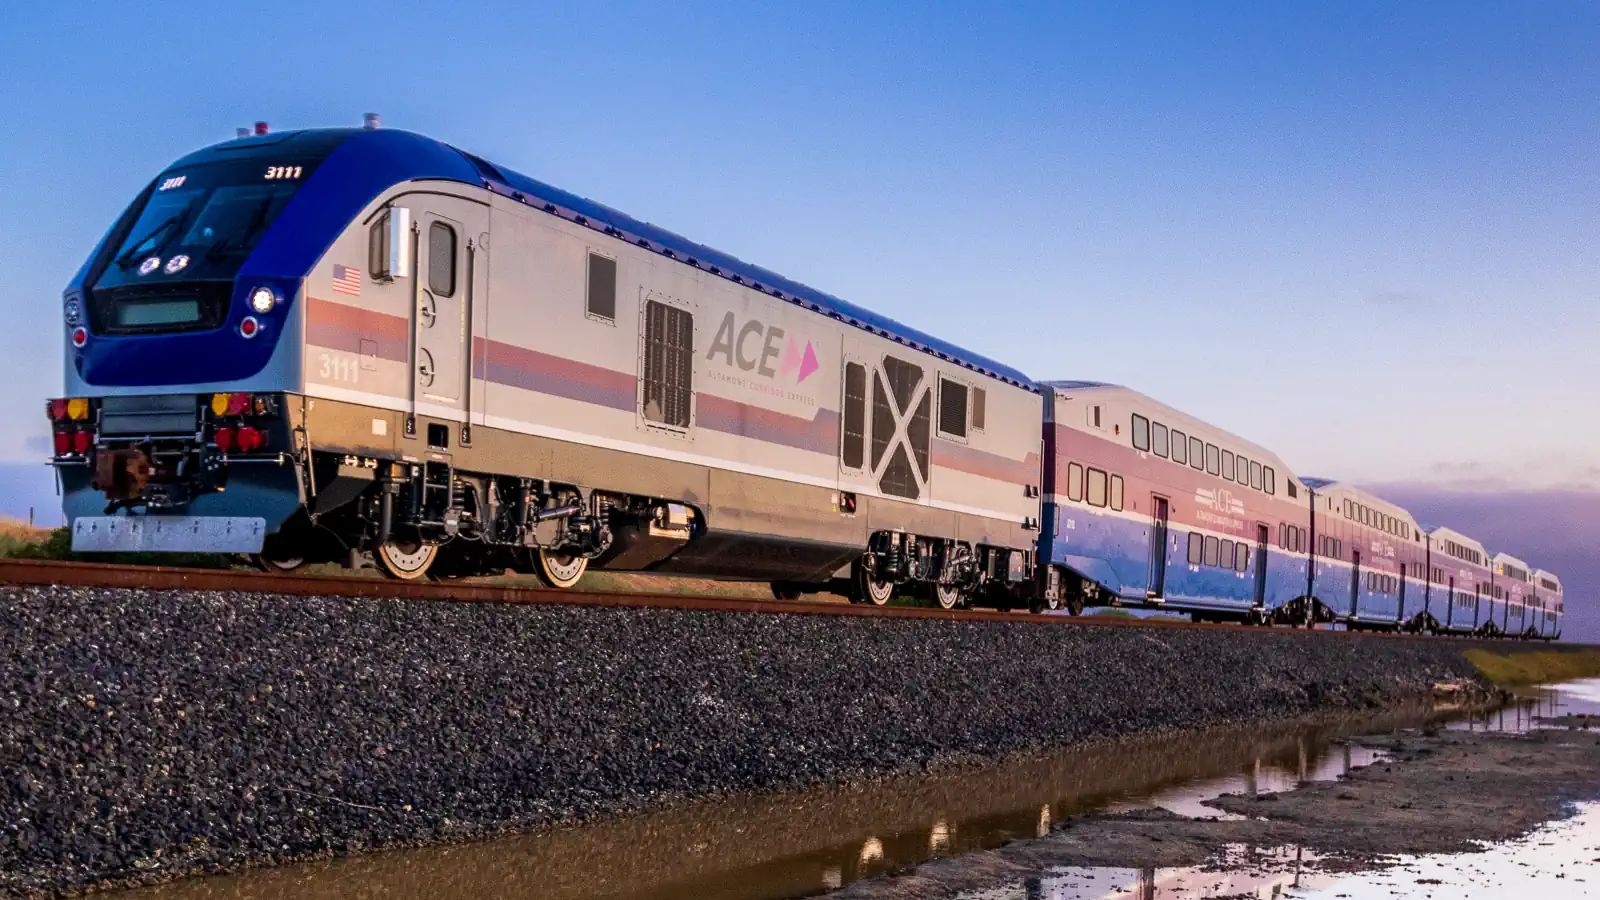
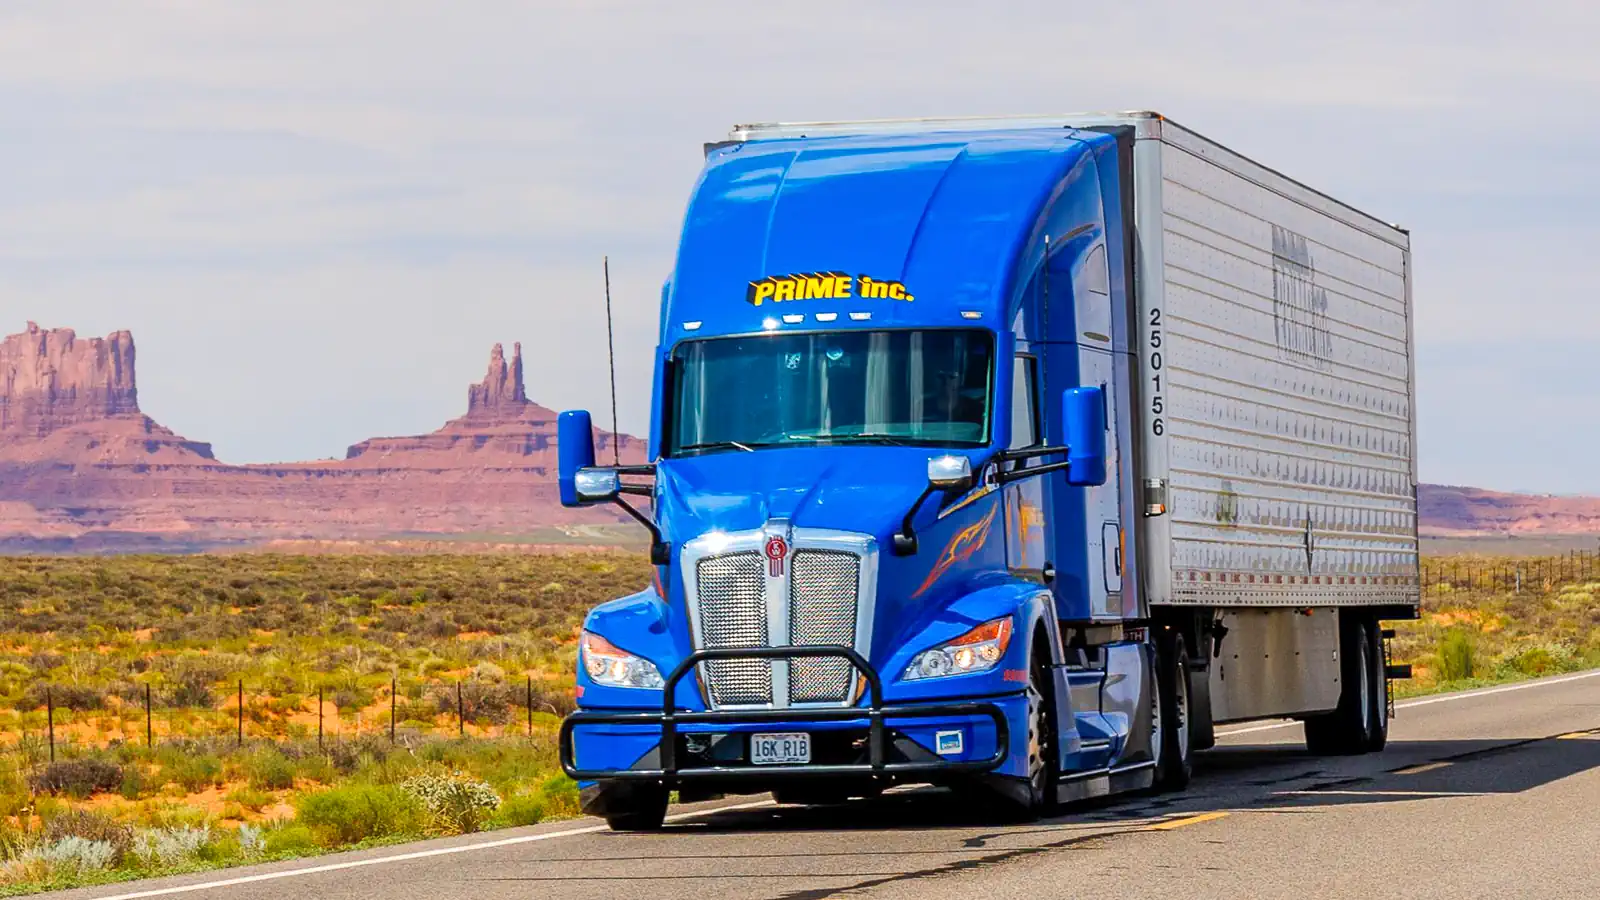
The July 2026 study reviewed five years of crash data across seven transportation categories. For every 100,000 registered motorcycles, about 1,112 end up in a crash each year. That beats passenger cars at 1,980, buses at 4,808, large trucks at 5,708, and light trucks at 7,151, the latter of which posted the highest crash rate of any mode studied. Only trains, at 194 per 100,000, and planes, at 570, came in lower.
Photo by Anand Dandekar via Pexels.
The bigger story in the data is how fast some of those crash numbers are climbing. Bus crashes have more than doubled over five years, up nearly 102%, the sharpest jump of any category. Large trucks are up about 28%, and light trucks are up about 28% as well. Trains rose roughly 18%. Passenger cars were the only group to improve, with total crashes down almost 4%.
Photograph by Sami Abdullah via Pexels.
Motorcycles did not escape the trend. Crashes involving bikes rose nearly 7% over the same five years. While it is one of the smaller increases on the list, it is still moving in the wrong direction. It’s a number that can be lowered through training, gear, everyday awareness, and improved decision-making.
Photograph by Optical Chemist via Pexels.
One reminder rides along with the good news: a lower crash rate does not mean a safer outcome once metal meets pavement. A fender-bender that dents a car door can have much more serious consequences for a motorcyclist. Although riders crash less often, we have far less protection in the event of an accident.
Photograph by Igor Passchier via Pexels.`
A legal analyst from Aghnami Law Group put the findings this way:
“The crash trend that should keep drivers awake at night is not the one making headlines. Bus accidents have doubled in five years. Large trucks and light trucks are crashing nearly a third more often than they used to. Passenger cars are the only category where the numbers are heading down. Most drivers worry about the car next to them. The data says they should be watching the bus behind them and the semi in the next lane.”
For us, the takeaway is worth remembering the next time someone claims motorcycles are reckless. On a per-vehicle basis, bikes crash less than the cars, trucks, and buses sharing the road with them.
Crash rates by mode, ranked from lowest to highest:
Mode of Transportation
Average Annual Crashes per 100k Registered Vehicles
Number of Registered Vehicles in 2024
Average Number of Crashes in a Year
5-Year Percent Change in Total Crashes
Train
194
1.63M
3158
18.11%
Plane
570
211k
1203
5.35%
Motorcycle
1112
9.26M
102.9k
6.83%
Automobile
1980
205.55M
4.07M
-3.80%
Bus
4808
1.10M
52,715
101.98%
Large Truck
5708
16.08M
917.9k
28.32%
Light Truck
7151
65.53M
4.69M
28.06%
Source: Aghnami Law Group, July 2026. The study combined fatal, injury, and property-damage-only crashes to reach the total number of incidents.
Our bike review this episode is the Yamaha MT-03. Do not underestimate this bike; you get a lot of motorcycle for your money! Associate Editor Kelly Callan rode the smallest MT for several weeks, and that included commuting on it. One of the things that impressed her, was how the MT-03 acted like a larger motorcycle. Kelly also spent some time chasing Editor Don Williams through the canyons when he was on the Yamaha MT-07—obviously a much larger machine. She tells us about how it all went.
* * * * *
We’re closing in fast on the 34th annual Biketoberfest, October 15–18, when all roads will lead to Teddy Morse’s Destination Daytona—the more than 100-acre motorcycle playground in Ormond Beach Florida. This week we get to hear all about it from Teddy Morse himself. With his trademark high energy and enthusiasm, he tells us all about his recently established Triketoberfest that happens the week before, and how the Destination Daytona complex turns into a full-throttle hub of demo rides, vendors, custom builds, live music, food trucks, shops, and nonstop pavilion energy. So, whether you’re on two wheels or three, whether you’re hunting parts or lining up a test ride; grab a cold one and soak up the energy and gorgeous Florida fall weather. This is one of the many Daytona Beach places where Biketoberfest feels like home. So don’t forget: make sure you download the Biketoberfest mobile App from Apple or Google Play or visit www.biketoberfest.org and we’ll see you there!
* * * * *
Our guest this episode is Greg Arnold, Mecum’s motorcycle auction director. He bought his first bike at eleven, joined the company in 2011, and has spent more than a decade helping turn this incredible event into the place collectors, consignors, and dreamers all show up. Next February 3rd through 6th, Mecum will—for the 36th time, bring the world’s largest vintage motorcycle auction back to South Point, Las Vegas. That’s over two thousand bikes over four days. Board-track racers, barn finds, customs, race iron, and especially, those incredible machines that make the room go quiet. Greg gives us insight into what it takes to make this event work so incredibly well, and if you’re interested in selling your pride and joy, what steps you have to take to make it happen.
* * * * *
Here’s quick reminder to check out our monthly digital magazine. It’s filled with everything you want to read on motorcycling, including some things you’ve probably not seen elsewhere. It’s absolutely free and you will find it on the Apple App Store and of course on Google Play as well.
Don’t forget to leave us your comments on our social media—we’re on all the usual platforms at Ultimate Motorcycling. We love hearing your feedback… so good or bad, please let us know what you think. If there’s something you’d like us to cover, we’d love to hear those ideas too!
We use cookies and browser activity on this website
Functional
Always active
The technical storage or access is strictly necessary for the legitimate purpose of enabling the use of a specific service explicitly requested by the subscriber or user, or for the sole purpose of carrying out the transmission of a communication over an electronic communications network.
Preferences
The technical storage or access is necessary for the legitimate purpose of storing preferences that are not requested by the subscriber or user.
Statistics
The technical storage or access that is used exclusively for statistical purposes.The technical storage or access that is used exclusively for anonymous statistical purposes. Without a subpoena, voluntary compliance on the part of your Internet Service Provider, or additional records from a third party, information stored or retrieved for this purpose alone cannot usually be used to identify you.
Marketing
The technical storage or access is required to create user profiles to send advertising, or to track the user on a website or across several websites for similar marketing purposes.